Pattern Recognition Applet: Class Dependent Principal Component
Analysis
In class dependent PCA we generate multiple covariances, one for each
data set. Also, instead of having a single transform as in the case of
class independent PCA, we have multiple transforms, one for each data
set. Points from the current space are mapped to the new feature space
my multiplying it with the transpose of the transform.
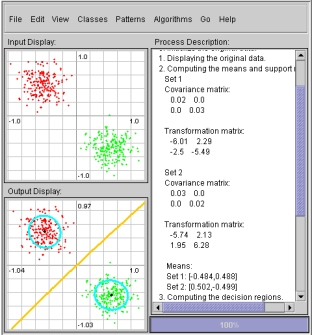
- The linear transformation
 which is used to transform points
from the current space to a new feature space is
determined using:
which is used to transform points
from the current space to a new feature space is
determined using:

The main objective of transformation is to make the covariance
of  an identity matrix.
We desire
to be an orthonormal transformation.
- The transform is defined by the eigen vectors and eigen values
of the covariance. The eigen vectors describe the coordinate
system of the new feature space and the eigen values describe the
variance of the data set in the new feature space. Note that the
reason we use the covariance to obtain the transform is because we
need to maintain the structure of the distribution, and the covariance
of the data set gives us the structure of the distribution. The
transform is obtained using the following formula:
 Where
Where  are the
eigenvalues and are the
eigenvalues and  are the eigenvectors of the covariance. are the eigenvectors of the covariance.
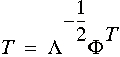
- Here is a brief example of how the class dependent PCA scheme works:
First select the Two Gaussian data set from the
Patterns menu. Following that select the Class
Dependent PCA option under the Algorithms menu.
Initialize this algorithm by selecting Initialize from the
Go menu. In
order to compute the line of discrimination select, the Next
option under the Go menu. This will display the, first step
of the process, data sets in both the input plot (top left) and the
output plot (bottom left) of the applet. Also, the process description
box indicates which step you are currently on and the algorithm that
is currently being used to compute the line of discrimination.
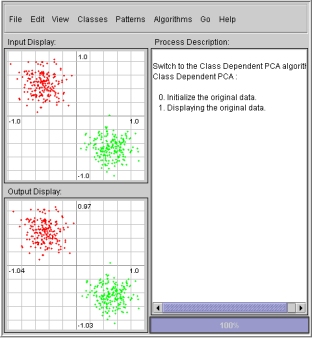
- The second step of the process computes the mean of the each
data set. The mean of each data sets is displayed on the output plot
as black dots near the corresponding data sets. The value of the mean
for each data set, which corresponds to the current scale, is
displayed on the process description box. The covariance and
transformation matrices used to compute the line of discrimination for
the data sets are also displayed in the process description box.
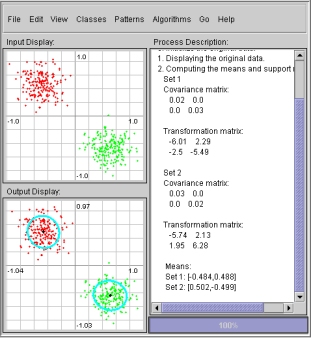
- The third step of the process displays the line of
discrimination of the given data sets as determined by the class
dependent PCA algorithm. Also, the classification error for each
data set along with the total classification error is displayed on the
process description box.
Click here to go back to the main tutorial page.
|
